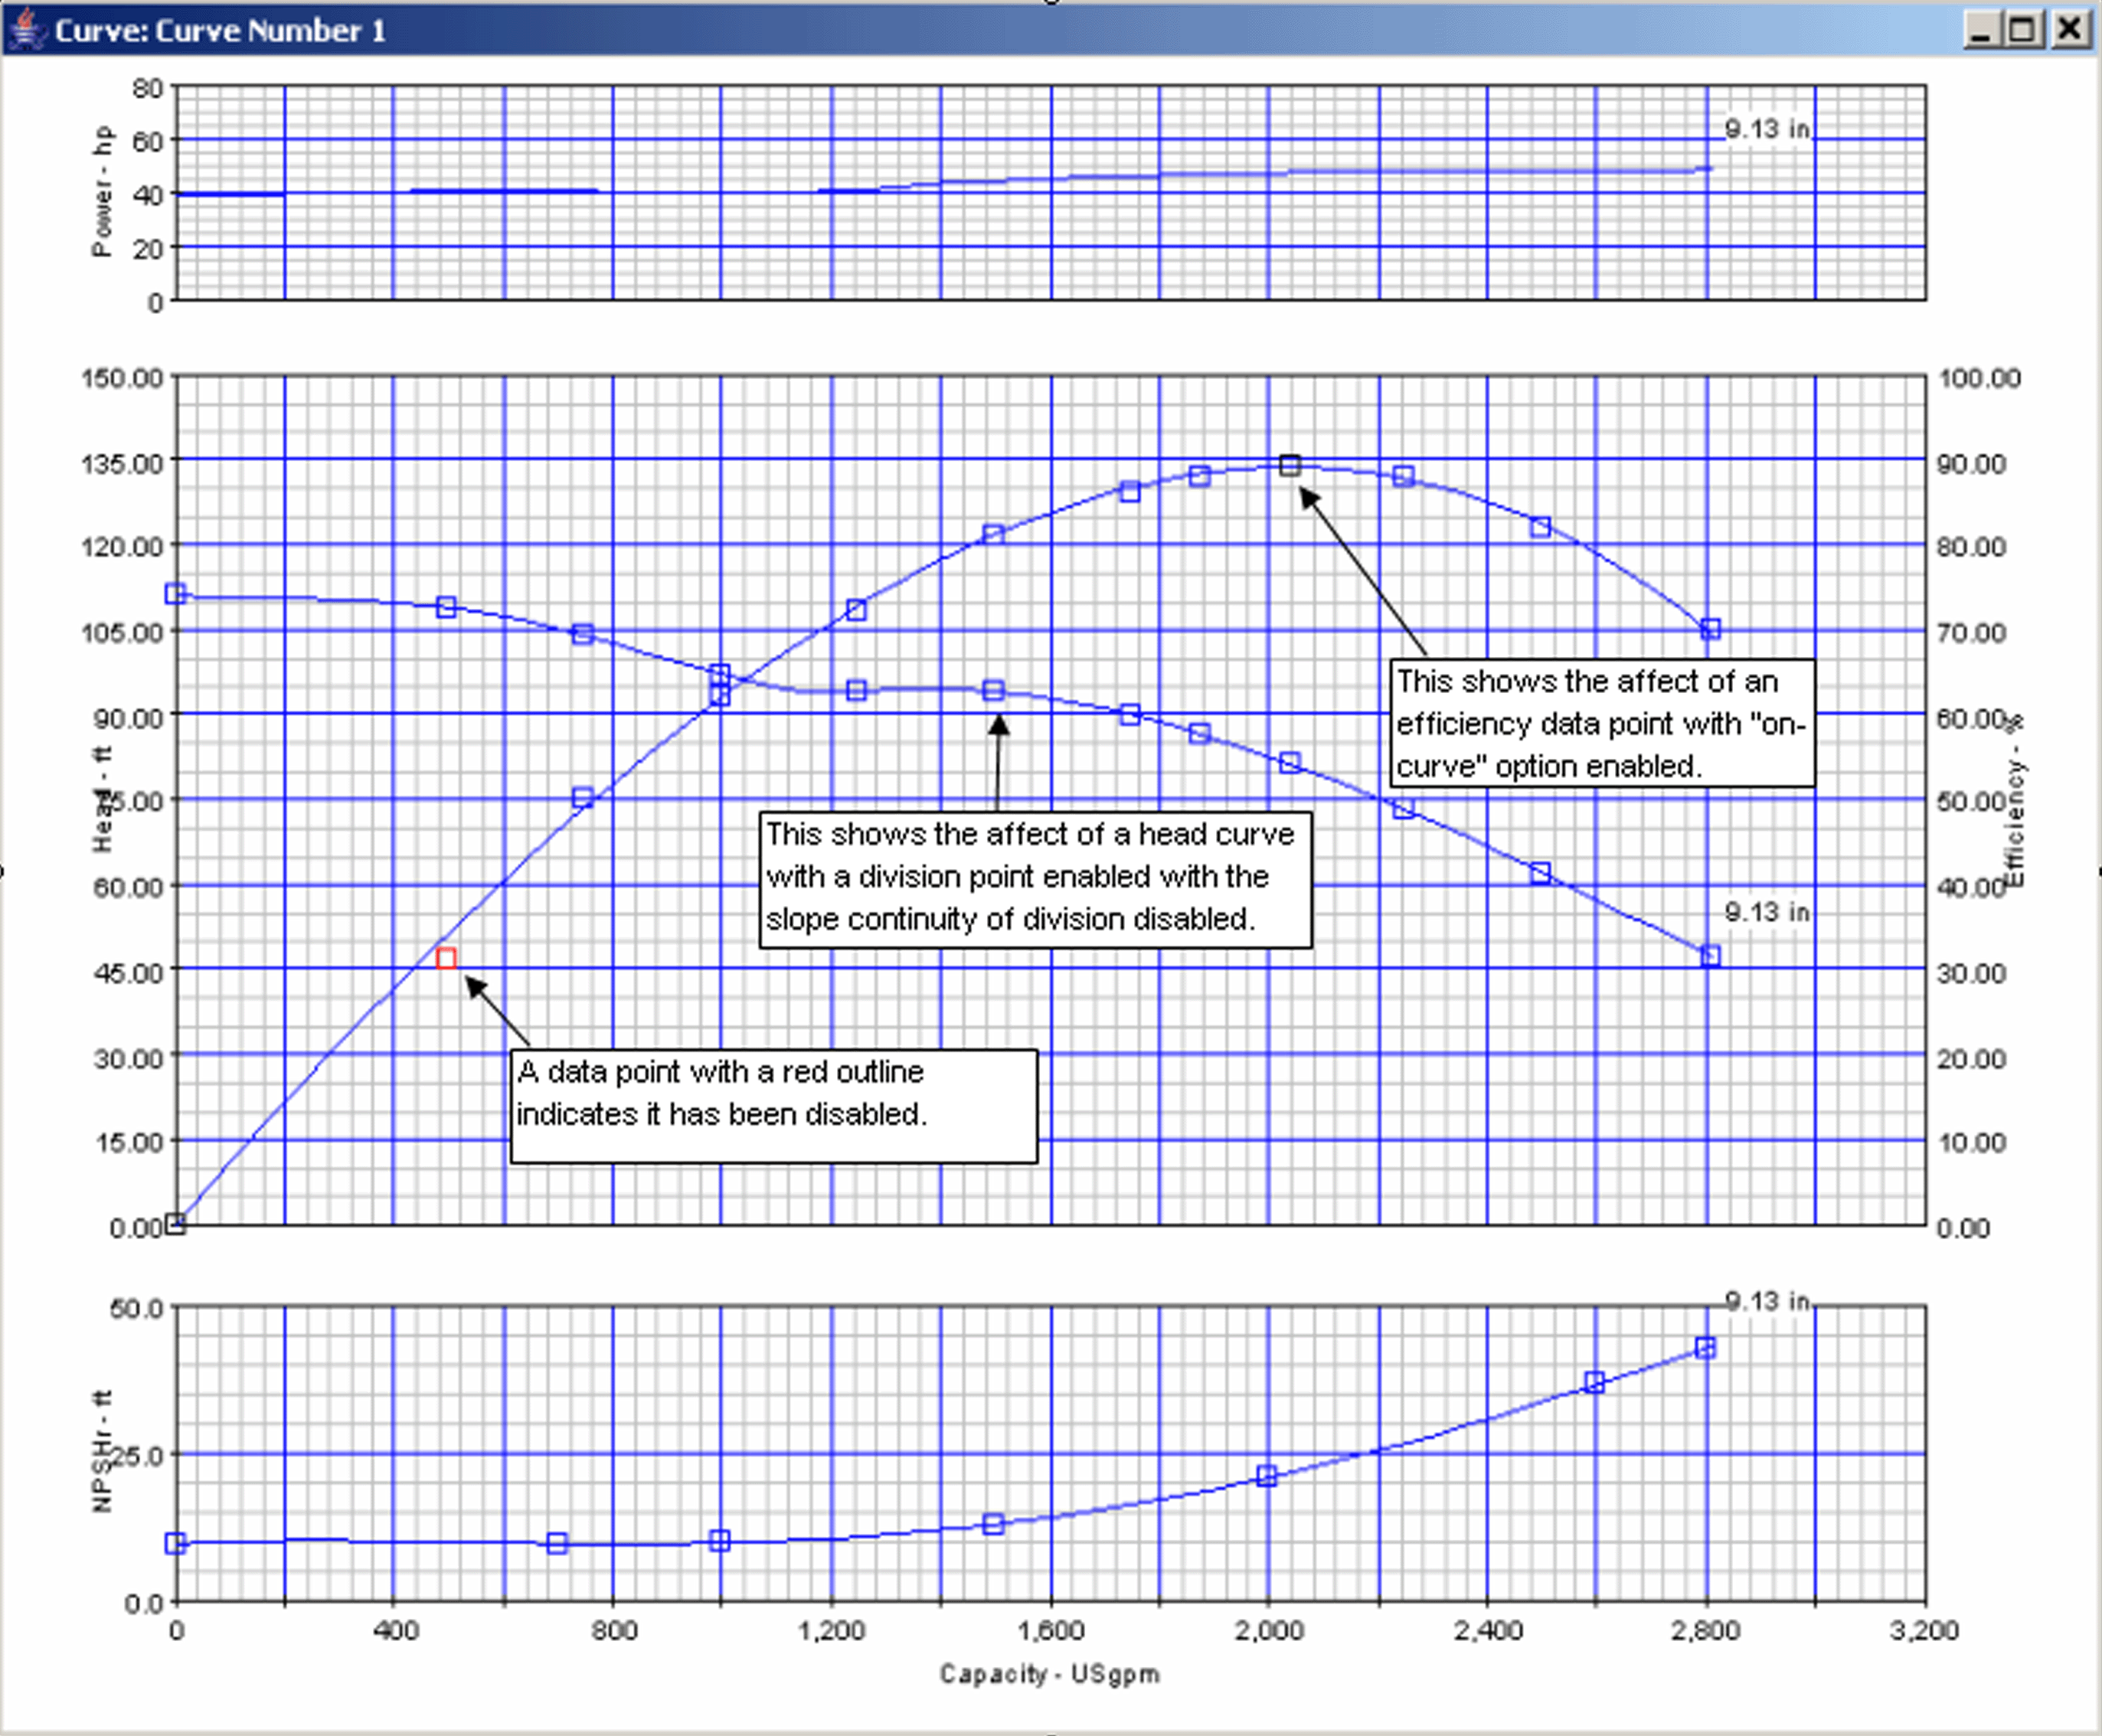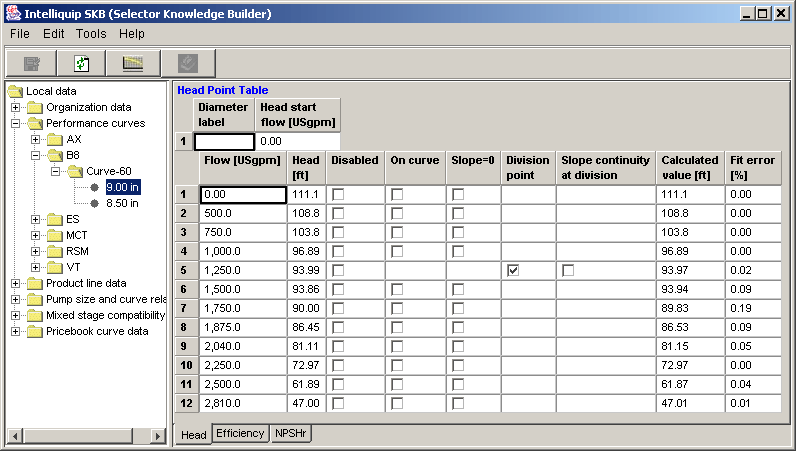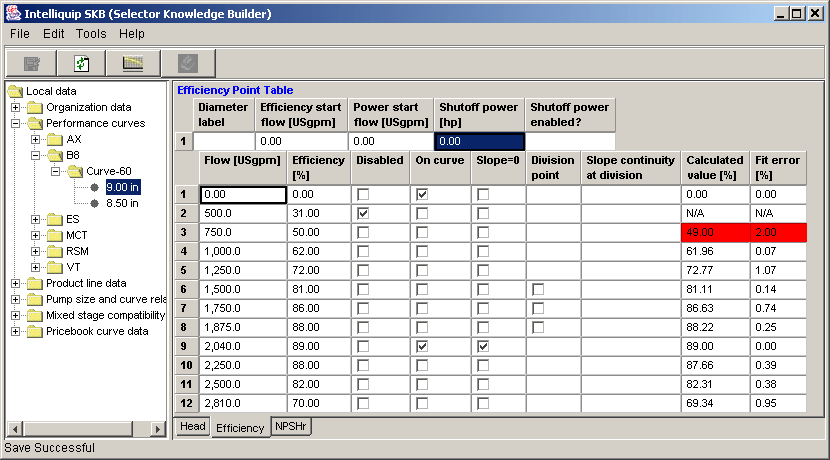
The image below shows a performance curve which has been manipulated using the curve fit options. The head curve shows the affect of a division point with slope continuity at division disabled. The efficiency curve shows the maximum efficiency point using the "on-curve" option and the lowest efficiency point set to disabled. To see the options selected in the table, click the Head Point Table or Efficiency Point Table link below.


