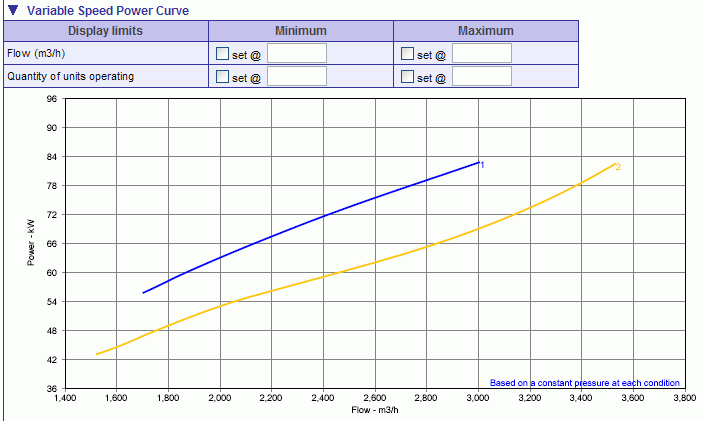
The Variable Speed Power Curve compares the input power at each condition based on a constant pressure. The image below is an example of the Variable Speed Power Curve twistie on the Performance Datasheet page.
Click on the fields below for more information.
These fields allow the user to increase or decrease the x-axis range of the curve based on specified flows.
In cases that use multiple compressor units, these fields allow the user to increase or decrease the x-axis range of the curve based on the number of operating units.