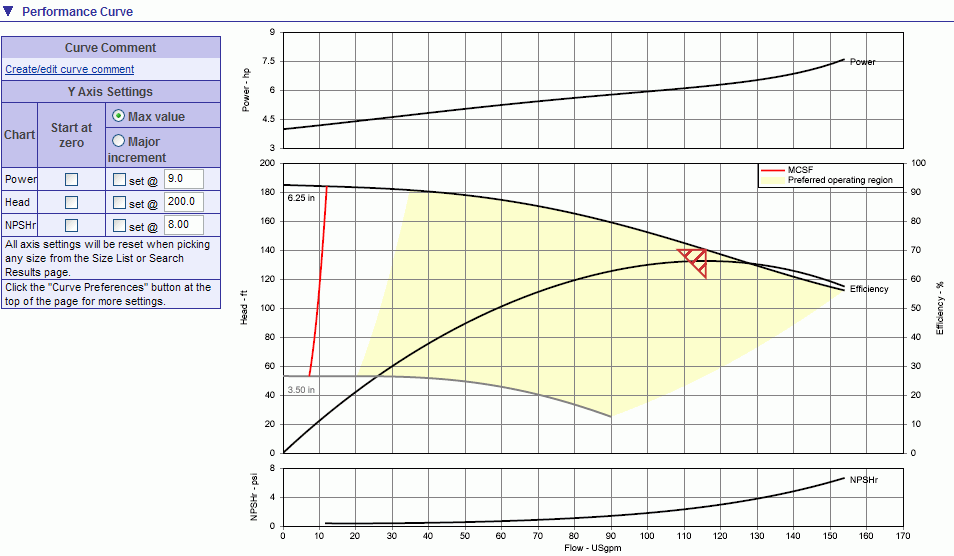
The performance curve section display a graphical representation of the selection. The content can be modified using curve preferences. The image below is an example of a typical Performance Curve twistie of the Performance Datasheet page.

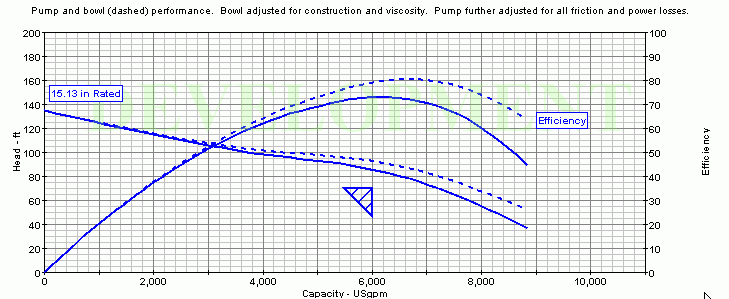
For vertical pumps the performance curve can show "Pump performance", "Bowl performance" or both. Use the Curve Preferences button to set the required display. The image below represents the conditions in the above tables for head measured at discharge nozzle centerline, and helps to describe what "Pump performance" and "Bowl performance" represent.
The bowl performance curve (dashed line) represents head and efficiency that has been adjusted to account for "derates" due to construction (stages, material of construction etc.) and viscosity. In other words, the "derates" were applied to the entire performance curve prior to determining an impeller diameter that would generate the required head.
The pump performance curve (solid line) represents the bowl performance further adjusted to account for friction (column, adaptor, discharge head and can) losses and power (lineshaft bearing and thrust bearing) losses. The reduced head and increased power are used to determine the pump efficiency.
Note that pump performance is not adjusted to account for static lift from any low liquid level to the discharge nozzle centerline (or wherever the user specified the head was measured at). Therefore, any static lift will result in the duty point being below the head curve.

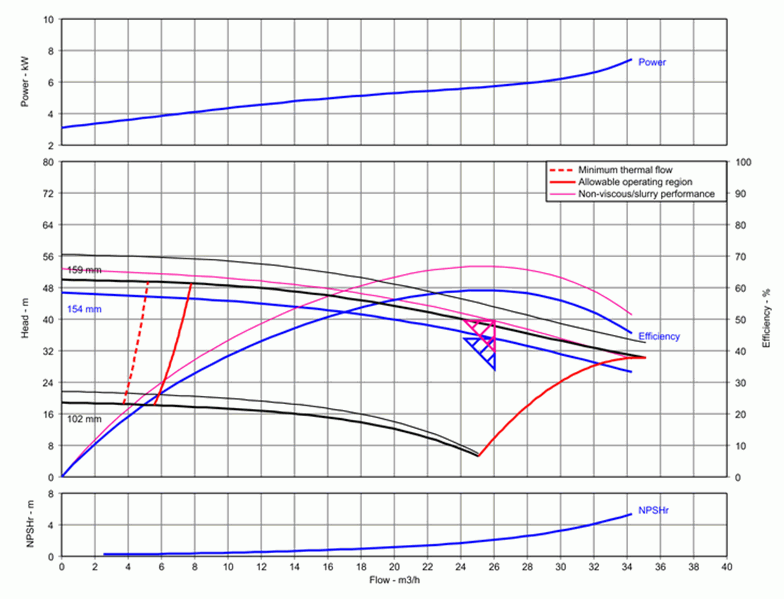
For the slurry pump the performance curve can show ”slurry/viscous performance” or ”Non-viscous/slurry performance” or both. Use the Curve Preferences button to set the required display. See the relevant curve below.

See below for more information.